


by Melanie, on 21 Apr 2020
One of the reasons why I first loved working in digital marketing was that the results were so much more transparent than in traditional marketing. It's relatively simple when someone is online to track their behavior and get helpful insights into what's working (and what's not) within your messaging, design, offers, product, etc.
There is a downside to this, though. There's just SO much data! SO many things you can measure!
While I'm not mathematically-inclined (or even remotely talented), I do love to look at data and trends. As others who feel the same way will attest, you can quickly become an Alice in Wonderland type, unable to find your way out until your boss yells at you to do something more productive.
When we were creating a marketing report format, one client of mine ended up listing over 90 different variables that they wanted to report and analyze on a weekly basis.
It's one thing when you are a large company and have both the human and technical resources to facilitate this level of analysis. Enterprise-scale businesses are also working with a totally different volume of data than most early-stage or growth-stage companies. Most startups and earlier ventures that I've encountered don't generate the volume of website traffic or other data points that warrants advanced data analytics. In fact, the numbers can be so low, you risk reacting to noise rather than something of any statistical significance.
By focusing on the fewest number of most important metrics, you can avoid marketing data overwhelm and draw insightful conclusions about what really matters.
The first step is to decide what you want to measure and how often you want to update those metrics. For anything you put on this list, be very clear about what decisions you plan to make based on each particular metric.
Start simple.
The Big Questions
Here is my list of key questions that every business needs to answer - and where I recommend earlier stage companies should focus:
- How big is your market?
- How are your ad campaigns performing? Do you need to turn any off? Increase budget on ads that are performing well? Fix anything that's broken?
- How is your website performing? What can be improved?
- Is your audience and customer base growing?
- Are you making as much money as you should be?
- Are your customers happy?
- What are your competitors up to?
- How can you stay on top of all of this data?
These questions are in no particular order, but they are must-know's rather than nice-to-know's.
Measurement Schedule
You don't necessarily need to report all of these every week or even every month. Here are my recommendations for how often to review your data:
Daily
- How are your ad campaigns performing? Do you need to turn any off? Increase budget on ads that are performing well? Fix anything that's broken?

Weekly
- How is your website performing? What can be improved?
- Is your audience and customer base growing?
- Where are the best people coming from (source, geography)?
Monthly
- Are you making as much money as you should be? (this is not to say that you shouldn't be looking at revenue more than once each month!)
- What are your competitors up to?
Quarterly
- Are your customers happy? What can you do better?
- How well are you staying on top of the data? Are any changes to reporting necessary?
Annually (Or When a Major Change Happens)
- How big is your market? Did you miss any big changes?
Where to Find the Data
Next, let's walk through each of these questions and talk about where to find what you're looking for, hopefully saving you from having to search high and low for it - and potentially just ending up in the fetal position in a corner somewhere.
How are YOUR ad campaigns performing? Do YOU need to turn any off? Increase budget on ads that are performing well? Fix anything that's broken?
The first place to keep an eye on your campaign metrics are on the ad platform(s) that is/are hosting your ads (e.g. Facebook's Business Manager or Google AdWords). You should monitor your click-through rate, cost-per-click (CPC) or cost-per-impression (CPM) as well as the outcome metrics you've defined.
Then, go to your website analytics tools. Since you should always send ad traffic to a landing page - not your homepage - you will want to understand how many people have actually filled out a form or bought something on your website.

How is YOUR website performing? What can be improved?
There are a few places where you can evaluate how your website traffic is doing.
Google Analytics
Google Analytics is an absolute must-have on your website. It's free and will offer you a ton of data on who is visiting your website, where they are coming from, and what they are doing on your site.
You can compare conversion rates by geography, source, browser, and so on. If you take the time, you can also allocate revenue to particular sources.
Even if you have another marketing platform that captures these types of stats (e.g. if you also use HubSpot website analytics), you should still use Google Analytics because the results will vary slightly. I still prefer Google Analytics for answering certain questions, while HubSpot allows your team to see known contacts' actual website history, which is fantastic information to have at their fingertips.
Google Search Console
Another helpful (and free!) tool that Google offers is Search Console. This is where you can see how your website ranks for particular keywords. You will also be notified if there are any SEO issues on your website that are preventing Google from crawling and indexing your website.
HotJar
HotJar provides more qualitative reports than something like Google Analytics. Like many similar tools, it provides heat maps showing where most visitors spend time on your website. However, I really like being able to record users navigating the website. It doesn't use the webcam or anything quite that creepy - just a screen grab - but it's still a great way to understand which areas of your website might be confusing people and where you're losing them, which is very hard to decipher from numerical data alone.
Bonus!
Most, if not all, of these tools will require you to add tracking code to your website. This can get complicated if:
- You're not comfortable adding tracking code to your website. You may need to ask your developer to do this for you, which can get expensive.
- You accidentally mess up other code already working on your site. The less you have to mess with code, the better.
- Adding extra lines of code to your website causes it to load more slowly. This is NOT a good thing for SEO or your user experience. We want your site to load as fast as possible!
To mitigate each of these factors, you should use a tag manager - we recommend Google Tag Manager. The code for the tag manager becomes the only code you need to change on your site. Whenever you add or change other website tools, you do so through the tag manager interface and NOT directly on your website.
You shouldn't need a developer to do this and limiting the extra code will keep your site running nice and fast.

Is YOUR audience and customer base growing?
Two of marketing's four overarching goals are to grow an audience (so more people know about you) and then to grow a customer base (which means engaging your audience and converting them into sales).
When it comes to tracking audience growth, unless you want to hire someone to conduct a market survey and measure brand awareness, you should track your website visitors and social media followers. These are sometimes described as vanity metrics because they don't take into account whether visitors are actually engaging with content on your website, so supplement them with measurements of bounce rate and pages per session.
It's also a good idea to gather competitor intelligence by comparing your new follower count to theirs each month. Only do this for channels you really care about.
In terms of your customer base, the best way to track growth is through your CRM and/or sales database.
Where are the best people coming from (source, geography)?
To answer this, turn again to your website analytics tools, such as HubSpot or Google Analytics. You will need to ensure that whatever tool you're using can display traffic stats as well as what happens deeper into the visitor's journey, such as form submissions, demo requests, and purchases.
ARE YOU making as much money as YOU should be?
To answer this question, you will need a customer database. (Almost) everyone hates their CRM, usually because of unrealistic expectations! You will need to customize it so that it really works with your sales process. To do this it helps to have some familiarity with “database think”. Track your sales deals. Track your revenue.
In the B2B space, we like the CRM tools provided by HubSpot and Pipedrive.
In the ecommerce/B2C space, your needs are a little bit different. We like Drip for these companies.
What are YOUR competitors up to?
We believe the most important thing for you to focus on is your customer and serving their needs, and that this will position you to win over your competition. Nevertheless, without spending too much energy and time obsessing over it, you should still keep an eye on what your competitors are up to.
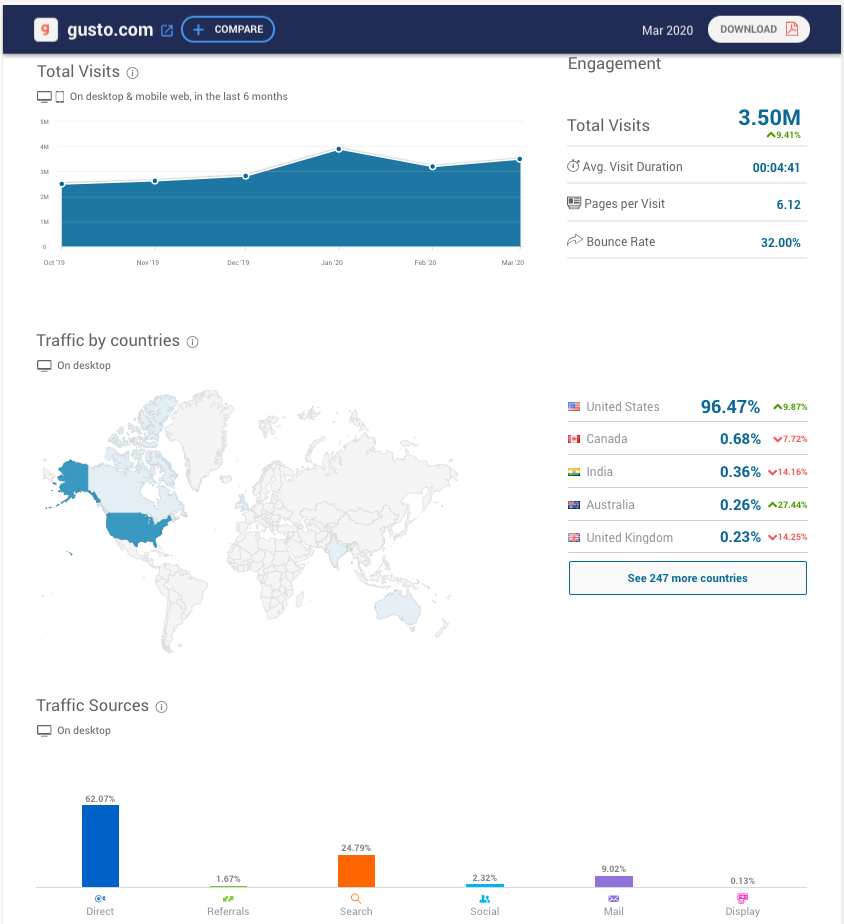
Two competitive intelligence gathering tools that we like for early-stage businesses are builtwith.com and similarweb.com. BuiltWith lists the tools and tech that any website has connected. SimilarWeb provides an overview of where a website's traffic is coming from, which is a great way to gain insight into your competitors' marketing strategy.
Are they ignoring some channels? Do you think this is because they've proven it doesn't work? Or is it a missed opportunity?
As you grow, you may need a more advanced competitor intelligence tool, such as Crayon.
Are YOUR customers happy? What can YOU do better?
The most commonly used metric here is the Net Promoter Score (NPS). Maybe you haven't heard it called that before, but I'm sure you'll remember companies asking you questions like: How likely are you to recommend us to a friend or colleague?
Respondents score your company or their experience interacting with you on a scale of 1-10. The process then involves comparing the number of top fans, neutrals, and detractors to end up with an overall NPS score.
It's best practice to include a second question that asks why each respondent gave you their particular score. While not required, this is a helpful way to gather qualitative feedback and identify contributing factors that purely quantitative measurements don't reveal.
To run your own NPS surveys, you can use tools like SurveyMonkey or MailChimp. Or, you can automate the process using HubSpot's Service Hub Pro or Delighted.

How can YOU stay on top of all of this data? Are any changes to reporting necessary?
This is something you should be continuously thinking about. In the beginning, you'll probably come up with all sorts of reports that you want to generate, formats you want to tweak, and frequencies that you want to change. But, once you get everything set up, you should only need to check-in every few months — perhaps on a quarterly basis — to look for ways of making your life even easier.
How big is YOUR market? Are there any big changes YOU MIGHT HAVE missed?
This is an important strategic question and potential investors will want to see your answer in fundraising decks.
The best sources that we've found for market size indicators — though you will need to extrapolate the information — are two of the largest social media companies: Facebook (B2C) and LinkedIn (B2B). Each of these platforms offers an audience builder tool that allows you to segment their total audience and estimate the size of your target market.
Math for Marketers
Lastly, I want to quickly go over some basic equations that marketers need to know. Consider this a cheat sheet!
| Growth Rate | (New Number – Old Number)/Old Number |
| Compound Growth Rate | [(New Number/Old Number)^(1/Time Units)]-1 |
| Delta | One Number – Another Number |
| Conversion Rate | Resulting Number/Original Number |
| Cost of Customer Acquisition (CAC) | Total Spent on Sales & Marketing/ # of Customers Gained |
| ROI | (Resulting Revenue – Money Spent)/Money Spent |
Next Steps
- List the questions that you want your analytics to answer and how often. Keep it simple!
- Write down the decisions you'll be able to make based on these metrics.
- Begin compiling your reports and tweak them until they're giving you maximum insights and value.
Photo Credits
Photo by Markus Spiske on Unsplash
Photo by STIL on Unsplash
Photo by Franki Chamaki on Unsplash
Photo by Bekky Bekks on Unsplash