


by Lina Panahi, on 19 Jan 2021
We’ve all heard the cliché: A picture is worth a thousand words. Maybe that saying is reserved for professional creative pieces, but it’s also a great way to describe what an infographic is and what it does: it tells a compelling story while using little text.
In this week’s SPT, we explore what makes infographics so effective for marketing (and beyond) and share a few of our favorite examples.
SEE WHAT I MEAN?
To understand why the popularity of infographics has grown, let’s start with why visuals in general are so engaging. Here are a few facts:
- People remember 65% of the information they see in a visual
- 90% of information transmitted to the brain is visual
- Visuals increase learning and information retention by 78%
- Visuals like charts, graphics, color design, and images increase readership by 80%
In the context of marketing, the most significant factor is that, because visuals are processed 60,000 times faster than text, telling a story with pictures rather than words is much more effective.
This is why platforms like Instagram and YouTube -- as well as memes and gifs -- are commonplace in each household and across all age groups. The content is easy to digest, engaging, and easy to share.
People want custom content that is useful, which is why infographics are increasingly popular among content marketers. A well done infographic can both drive traffic and showcase your brand.
One way your company can benefit from creating and using infographics is to educate your audience about your business. You can explain how your product or service works in a concise way and show the value to your customer without paragraphs of text.
If your company has customer survey data, statistics from sales reports, or information about industry trends, those can easily be turned into an infographic that provides useful insights to your customers.
Another way to use infographics is by repurposing content from blog posts, webinars, and white papers -- summarizing key points from a longer piece of content. This way the reader gets the main takeaways even if they don’t make time to read the entire piece.
Infographics can also prove helpful within your company. Visuals increase learning and information comprehension by 78%. Use infographics to summarize steps in a process, provide tips, helpful reminders, or checklists for your employees.
TIPS ON CREATING YOUR OWN INFOGRAPHIC
By now you are hopefully convinced that infographics are an effective marketing tool. Here are some tips to get you started.
- Choose a topic. Not just any topic, but one that is trending in your industry. First, decide on a target audience. Once you've narrowed that down, it will be easier to think of a topic that they will care about.
- Ensure the data you showcase comes from reliable sources. If you can find data within your own company, so much the better, as it will communicate a unique story.
- Write your narrative. Make sure your text and data tell a story and don’t feel disjointed.
- “Less is More.” We’ve all seen those infographics that are filled to each margin. The key is to not overwhelm your reader.
- Proofread and enlist a second set of eyes. You don’t want to find spelling mistakes after it’s been published and circulated.
- Pick a design and layout that best suits your story. Use your brand's fonts and colors. You’ll also need to choose the right resolution for your target medium - print, social, or mobile.
- Proofread (yes again!) This can't be stressed enough – you want to make sure that, besides spelling mistakes, the flow makes sense, the numbers are accurate, etc.
- Prepare to distribute your infographic. Decide how you want to share this with your audience. Whether it’s a landing page or through email or social media, make sure to use the right format and resolution and make it easy for people to share.
5 GREAT EXAMPLES OF INFOGRAPHICS
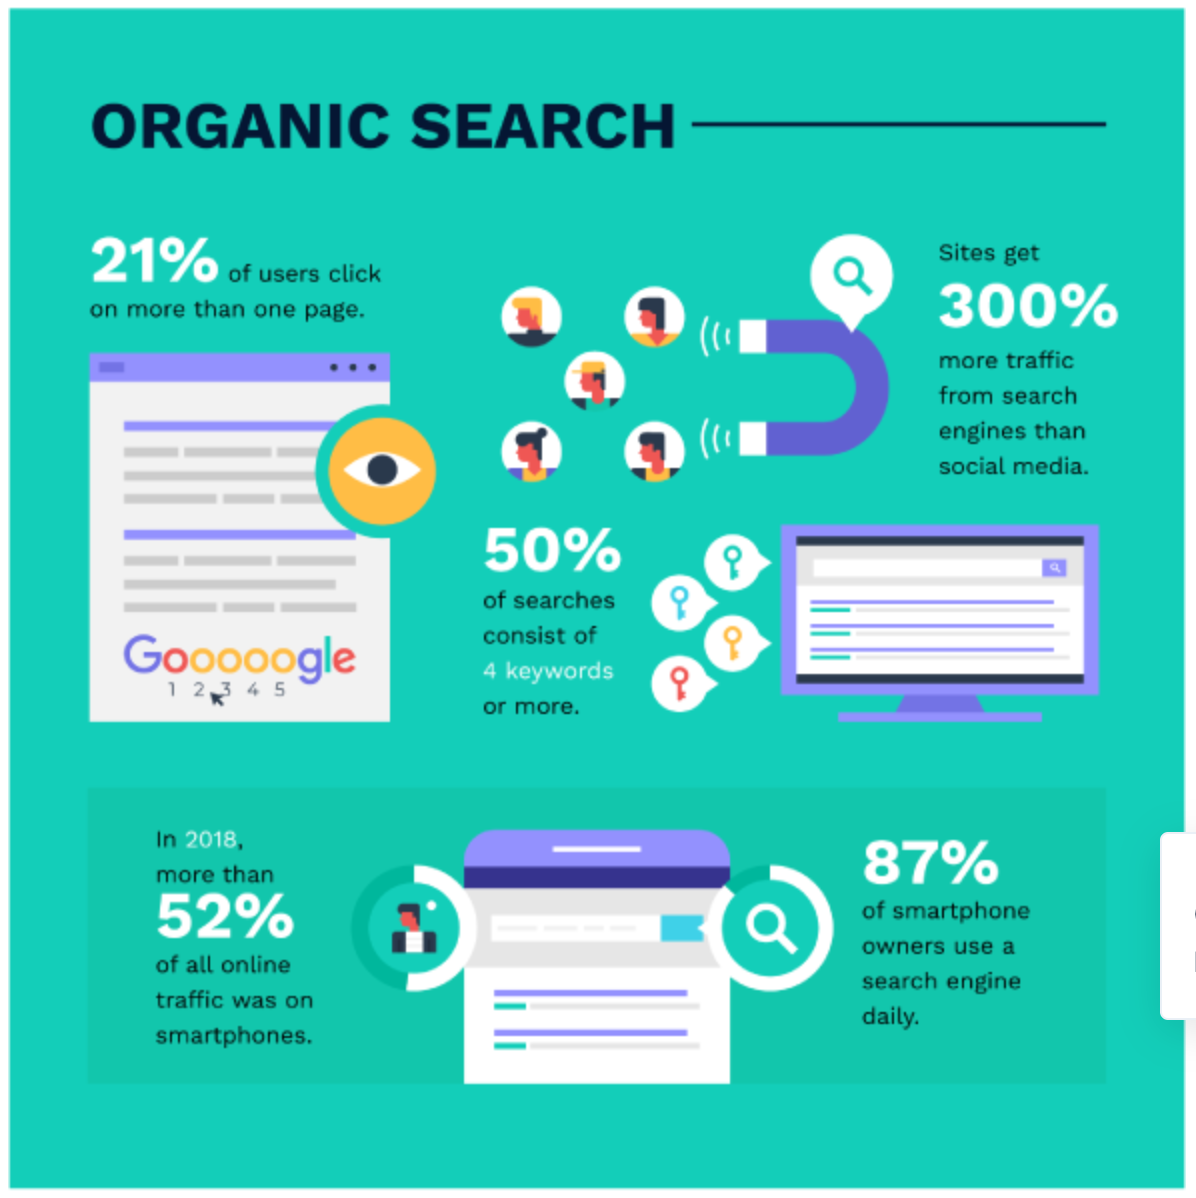
1/ Here’s a clip of an infographic about digital marketing trends. The stats it provides are handy in honing your marketing campaigns and deciding where to focus your efforts.
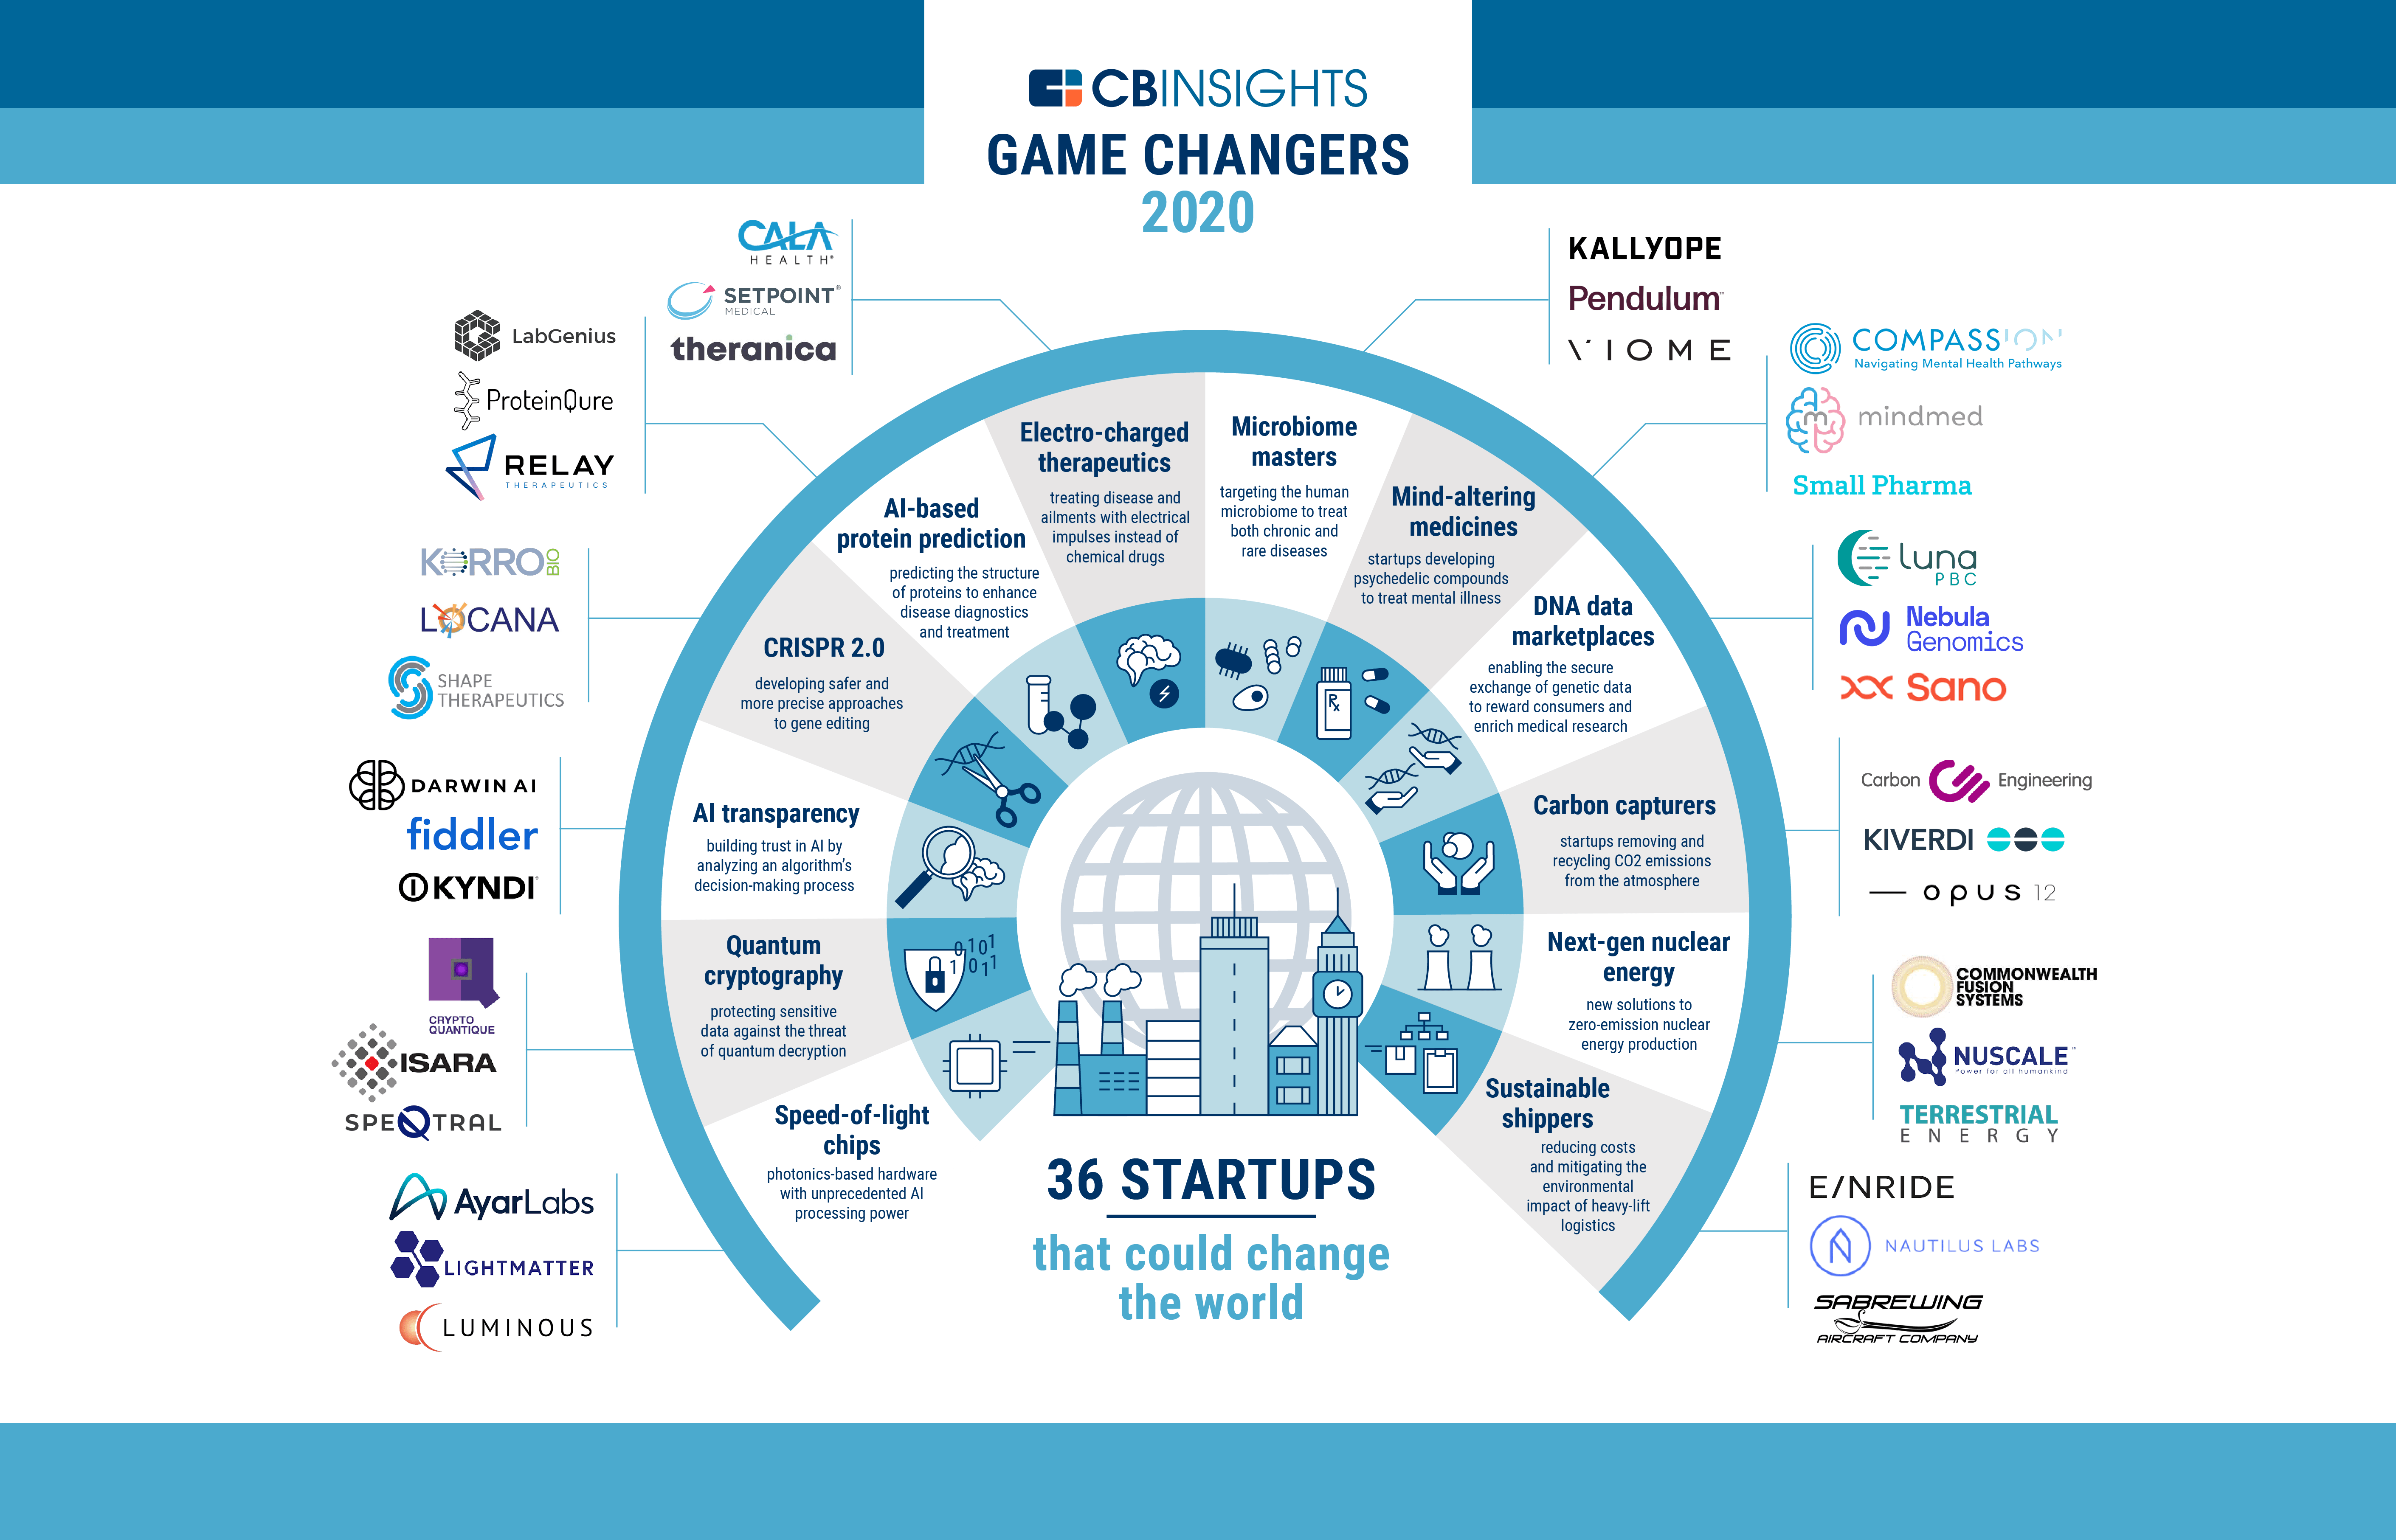
2/ Here is an infographic that showcases 36 companies that are paving the way to solve the world’s biggest problems. What’s unusual about this graphic is that it provides all the information in a landscape layout so everything can be viewed at a glance without scrolling.
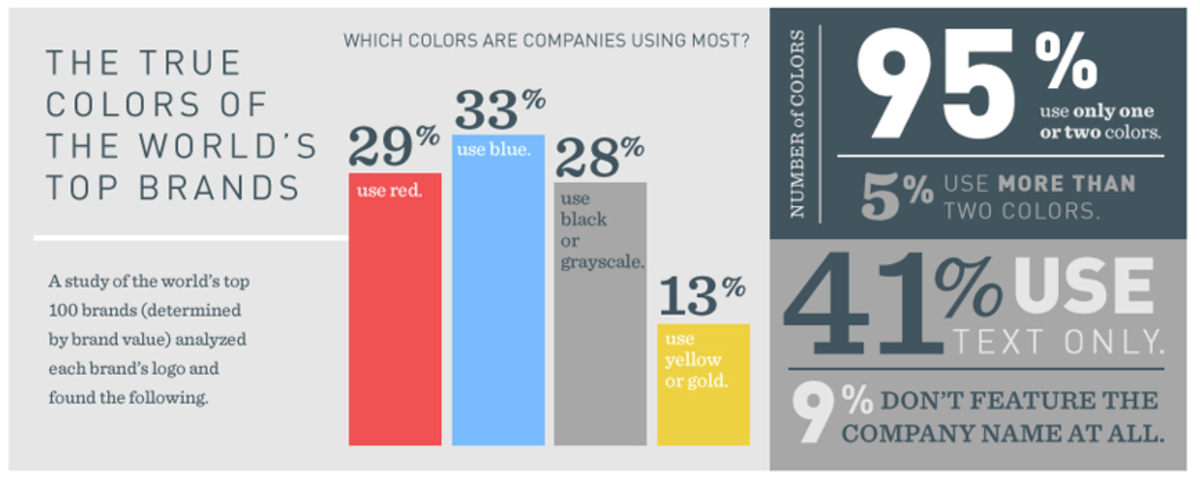
3/ This infographic is helpful when creating (or re-designing) your brand colors, but it’s also fascinating to know how important choosing the right colors can be and how it can influence a customer’s purchasing decision.
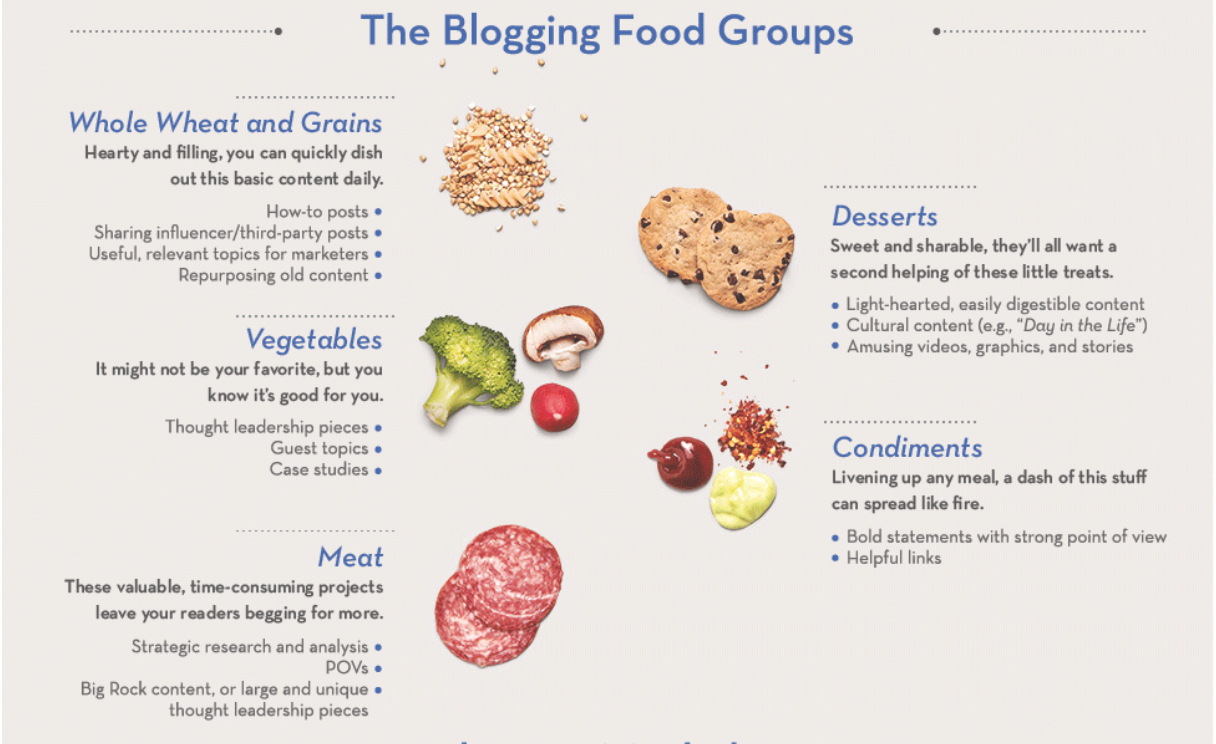
4/ This example from LinkedIn Marketing Solutions provides valuable tips to marketers in a clever way – visualizing them as food groups!
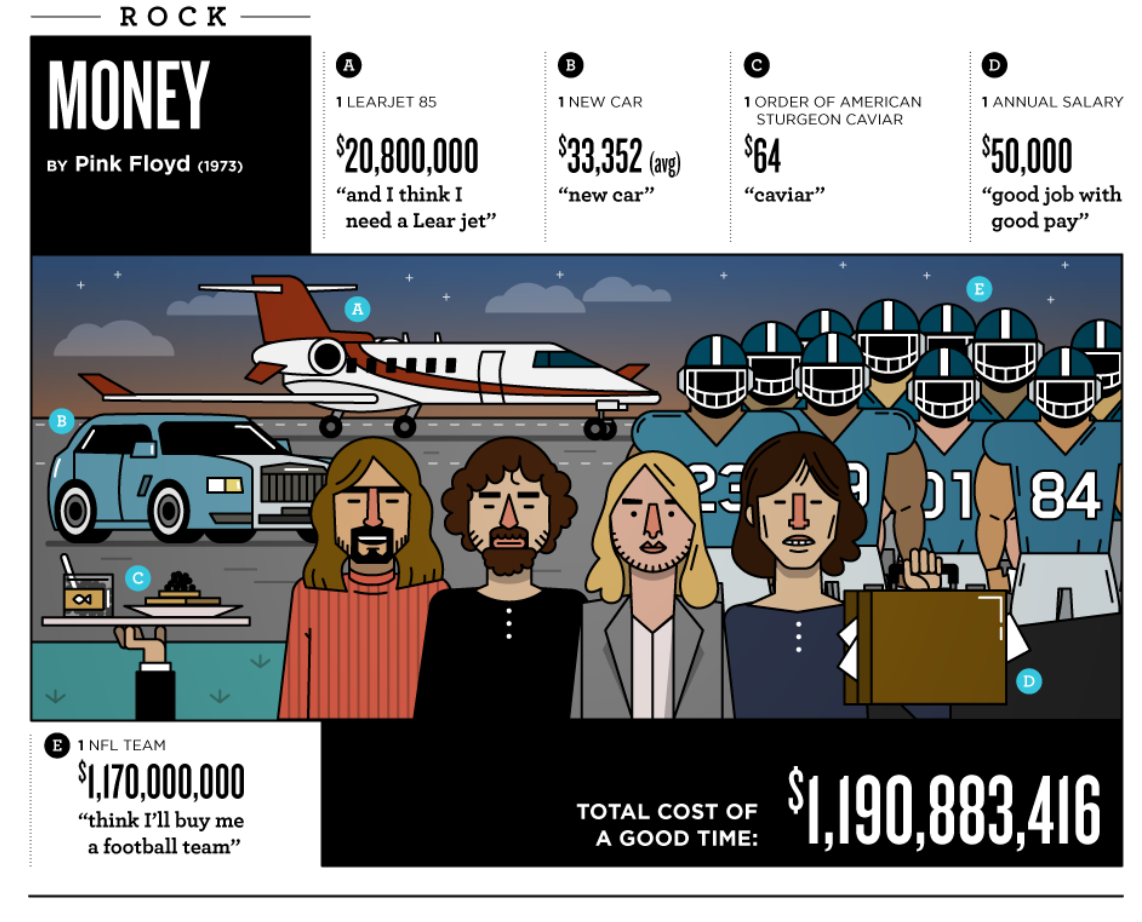
5/ Finally, here is a graphic that puts a humorous and creative spin on the potentially dull topic of money management...
key TAKEAWAYS:
- Visuals are important to marketing because our audience processes them faster than text.
- Infographics are a popular type of visual for content marketing.
- Infographics can be used in several ways, including explaining how your product or service works, showcasing your company's data, or internally for mapping processes or checklists.
- When creating an infographic, make sure your data is accurate and that it tells a unique or interesting story that is meaningful to your audience.